Architectures for Consuming events: Survey
Architectures for Consuming events: Survey
satya - 12/17/2023, 3:53:01 PM
What is azure data explorer?
What is azure data explorer?
satya - 12/17/2023, 4:01:40 PM
Some examples of event driven architecture usecases
- IoT (Internet of Things) Applications: Event-driven architectures are extensively used in IoT scenarios, where devices generate events (sensor readings, status updates) that trigger real-time processing and actions.
- E-commerce and Retail: Order processing, inventory management, and customer interactions in e-commerce platforms often utilize event-driven architectures for scalability and responsiveness.
- Financial Services: Fraud detection systems use event streams to analyze transactions in real time, identifying and responding to potentially fraudulent activities.
- Healthcare: Patient monitoring, health record updates, and real-time alerts in healthcare systems benefit from event-driven architectures for timely responses and data synchronization.
- Telecommunications: Call detail record (CDR) processing, network monitoring, and automated responses to network events are common in the telecommunications industry.
- Logistics and Supply Chain: Tracking shipments, managing inventory, and coordinating logistics operations involve event-driven systems to handle real-time updates and changes.
- Media and Entertainment: Content delivery networks (CDNs) leverage event-driven architectures to efficiently distribute and update content, adapting to changing demand dynamically.
- Social Media Platforms: Real-time notifications, updates, and user interactions on social media platforms rely on event-driven models for responsiveness and scalability.
- Gaming: Online gaming platforms use event-driven architectures for handling in-game events, matchmaking, and real-time player interactions.
- Energy and Utilities: Smart grid applications use event-driven systems to monitor and manage energy distribution, detect faults, and respond to changes in demand.
- Travel and Hospitality: Booking systems, reservation updates, and travel itinerary management benefit from event-driven architectures to provide timely information to users.
- Manufacturing: Predictive maintenance in manufacturing plants uses event-driven systems to monitor equipment health in real time and schedule maintenance proactively.
- Government and Public Services: Emergency response systems use event-driven architectures to process and respond to events such as natural disasters, accidents, or public safety incidents.
- Education Technology: Learning management systems (LMS) and educational platforms use event-driven architectures to handle user interactions, content updates, and progress tracking.
satya - 12/17/2023, 4:08:48 PM
Azure list of event streaming tools
- Azure Event Hubs
- Azure Service Bus
- Azure Functions
- Azure Logic Apps
- Azure Stream Analytics
- Azure Event Grid
- Azure Durable Functions
- Azure Notification Hubs
- Azure Data Explorer (KustoDB)
- Azure Storage Queues
- Azure IoT Hub
- Azure Event Store (Preview)
satya - 12/17/2023, 6:02:07 PM
Features of Azure data explorer
- Data Ingestion: Azure Data Explorer boasts a proprietary data ingestion mechanism that excels in handling real-time streaming data. This feature is pivotal for seamlessly managing and processing vast volumes of data generated by diverse sources such as applications, devices, and sensors.
- Storage Layer: At the heart of the platform is a storage layer meticulously optimized for columnar storage. This choice ensures the efficient and rapid retrieval of data during analytical queries, a critical aspect of its capability to handle complex and large-scale analytics tasks.
- Query Engine: Driving the analytics capabilities is a proprietary query engine fine-tuned specifically for executing queries written in the Kusto Query Language (KQL). This engine provides a powerful and expressive tool for real-time analytics, facilitating the extraction of meaningful insights from the stored data.
- Cluster Management: The platform's cluster management component plays a foundational role in orchestrating clusters of nodes. These clusters, distributed and elastic, can dynamically adjust to varying workloads, ensuring scalability to meet the demands of real-time data processing and analysis.
- Indexing Mechanisms: Azure Data Explorer incorporates indexing mechanisms that significantly contribute to query performance. These mechanisms allow for quick retrieval of specific data points without the need to scan the entire dataset, enhancing the overall efficiency of analytical processes.
- Security Integration: Security is a top priority, and Azure Data Explorer seamlessly integrates with Azure Active Directory for robust authentication and authorization. Encryption mechanisms are employed for both data in transit and at rest, ensuring the confidentiality and integrity of the data being processed and stored.
- Monitoring and Management Tools: The platform provides a suite of monitoring and management tools that offer insights into cluster performance, query execution, and data ingestion rates. These tools empower administrators and users to effectively manage and optimize their Azure Data Explorer deployments. Additionally, integration with Azure Monitor and Azure Security Center extends monitoring and security capabilities.
- Global Distribution: Designed to be globally distributed, Azure Data Explorer allows clusters to be deployed across multiple Azure regions. This flexibility enables organizations to analyze data close to its source or distribute workloads for global applications, supporting diverse use cases across industries.
satya - 12/17/2023, 6:02:44 PM
What is the architecture of Azure Data Explorer and its components
What is the architecture of Azure Data Explorer and its components
Search for: What is the architecture of Azure Data Explorer and its components
satya - 12/17/2023, 6:11:37 PM
Key components
- data ingestion,
- query,
- visualization,
- and management.
satya - 12/17/2023, 6:13:52 PM
Key features
- Analyzing structured, semi-structured, and unstructured data
- Across time series,
- Using Machine Learning,
- extract key insights,
- spot patterns and trends,
- Create forecasting models.
satya - 12/17/2023, 6:14:33 PM
Approach
- A traditional relational model,
- organizing data into tables with strongly-typed schemas.
- Tables are stored within databases,
- and a cluster can manage multiple databases.
satya - 12/17/2023, 6:14:56 PM
Useful for
- log analytics,
- time series analytics,
- IoT,
- and general-purpose exploratory analytics.
satya - 12/17/2023, 6:22:51 PM
When is ADX not suitable
When is ADX not suitable
satya - 12/17/2023, 6:24:17 PM
When is ADX not suitable
- ETL
- Complex ETL
- Medium size data
- Lot of updates as opposed to appends
satya - 12/17/2023, 6:26:29 PM
When is ADX not suitable
When is ADX not suitable
satya - 12/17/2023, 6:29:43 PM
When is ADX not suitable
- Real time analytics
- Time series
- Logs
- Operational
- Geo spatial
- Scaling
satya - 12/17/2023, 6:31:34 PM
Real time analytics
- Real-time analytics involves the analysis of data as it is generated or received, providing immediate insights and actionable information.
satya - 12/17/2023, 8:21:19 PM
In what typical ways data is ingested in real time analytics?
- Message queues
- Logs
- Events
satya - 12/17/2023, 8:24:03 PM
What kind of optimizations are needed for querying real time analytical data?
What kind of optimizations are needed for querying real time analytical data?
Search for: What kind of optimizations are needed for querying real time analytical data?
satya - 12/17/2023, 8:25:07 PM
What are the essential elements of real time query engines? How do they work?
What are the essential elements of real time query engines? How do they work?
Search for: What are the essential elements of real time query engines? How do they work?
satya - 12/17/2023, 8:29:03 PM
What is the nature of real time query engines?
What is the nature of real time query engines?
satya - 12/17/2023, 9:08:29 PM
Popular real time analytics systems
- Apache Flink
- Kafka Streaming
- Apache Spark Structured streaming
- Amazon Kinesis
- Azure stream analytics
- 12/17/2023, 9:11:03 PM
Two kinds of analytics
- Ingestion time analytics
- (Post) Query time analytics (lake, database, warehouse)
annonymous - 12/17/2023, 9:13:51 PM
Can delta lake be used as an input stream to Flink?
Can delta lake be used as an input stream to Flink?
Search for: Can delta lake be used as an input stream to Flink?
- 12/17/2023, 9:18:35 PM
When delta lake is used for streaming analytics, is that done during ingesting of data into the delta lake or after the data is made persistent in the delta lake?
When delta lake is used for streaming analytics, is that done during ingesting of data into the delta lake or after the data is made persistent in the delta lake?
satya - 12/17/2023, 9:25:07 PM
what are the differences between event time, processing time, and ingestion time?
what are the differences between event time, processing time, and ingestion time?
Search for: what are the differences between event time, processing time, and ingestion time?
satya - 12/17/2023, 9:29:57 PM
What is the difference between interactive analytics and real time analytics?
What is the difference between interactive analytics and real time analytics?
Search for: What is the difference between interactive analytics and real time analytics?
satya - 12/17/2023, 9:41:24 PM
Process of ADX
- Ingest data from Kafka into ADX
- Define target ADX table where you want to store the kafka data
- Define mappings
- Define transformations or enrichments
- Then query data in ADX tables using KQL
satya - 12/17/2023, 9:42:29 PM
In summary
- In summary, while tables in ADX can represent data from various sources, including external ones like Kafka,
- the actual ingestion process and mapping configurations need to be defined.
- Once the data is ingested,
- you can use KQL to query and analyze it in ADX.
satya - 12/17/2023, 9:46:29 PM
Equivalent to Flink in Azure: Azure Stream Analytics
Equivalent to Flink in Azure: Azure Stream Analytics
satya - 12/17/2023, 9:53:48 PM
If I need complex streaming analytics which is a better tool?
- Azure Stream analytics: Simple
- Flink: Advanced processing
- ADX: Ad hoc, Interactive analytics over large data
satya - 12/26/2023, 11:15:50 AM
ADC architecture diagram

satya - 12/26/2023, 11:29:33 AM
What it is for from their home page
- Fully managed data analytics service
- Real-time and time-series analysis on large volumes of data streams
- Business activities,
- human operations,
- applications,
- websites,
- Internet of Things (IoT) devices
satya - 12/26/2023, 11:30:31 AM
What you can do
- Ask questions
- iteratively explore data on the fly
- improve services and products,
- enhance customer experiences,
- monitor devices,
- and boost operations.
- Quickly identify patterns, anomalies, and trends in your data.
- Explore new questions and get answers in minutes.
- Run as many queries as you need,
- optimized cost structure.
satya - 12/26/2023, 12:19:04 PM
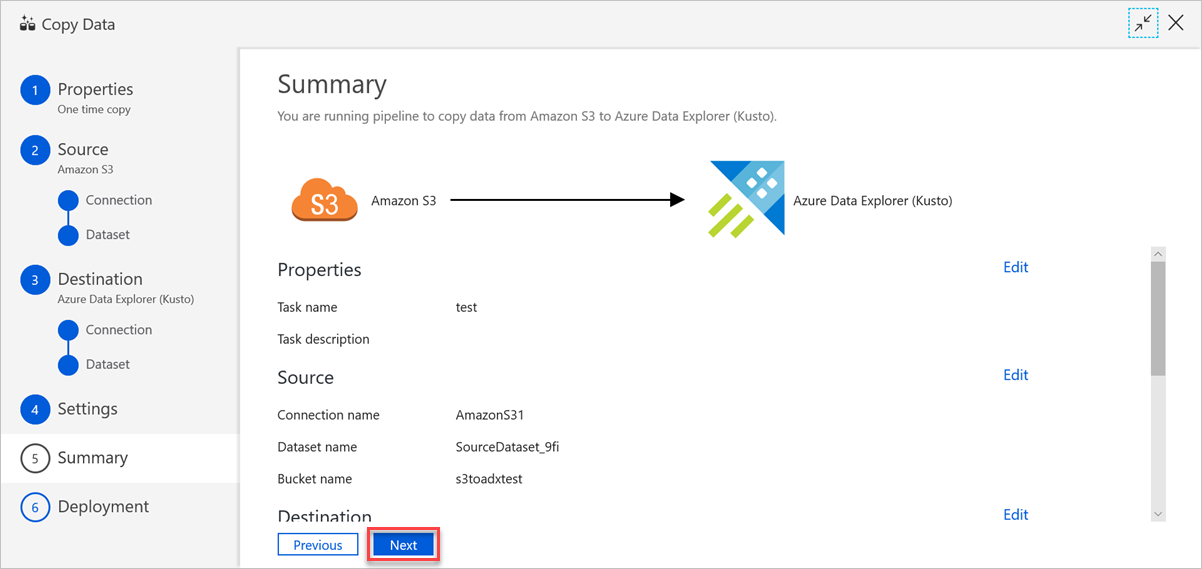
An example of data loading into ADE from DF using an ADE component
An example of data loading into ADE from DF using an ADE component
satya - 12/26/2023, 12:19:39 PM
Here is what this looks like
satya - 12/26/2023, 12:39:47 PM
Essentials of ADX
- It acts like a logical database managing its own storage
- Its abbreviation is ADX
- Leverages Azure Data Lake Storage as its underlying storage solution.
- ADX focuses on providing powerful analytics and querying capabilities on top of that stored data.
- ADX has apis and dedicated connectors that acts as "sinks" to ingest data from various sources including ADF
- ADX as it acts like a database it has similarly libraries to ingest and query data
- KQL is similar to SQL but tailored to the needs of analytics on semi-structured and structured data.
- KQL is particularly well-suited for working with time-series data. It includes functions and operators for handling timestamps, time intervals, and performing time-based aggregations.
- KQL is adept at working with semi-structured data, such as JSON. It supports extracting, querying, and transforming data in JSON format.
- Users can define custom functions and operators in KQL, providing a level of extensibility for specific use cases.
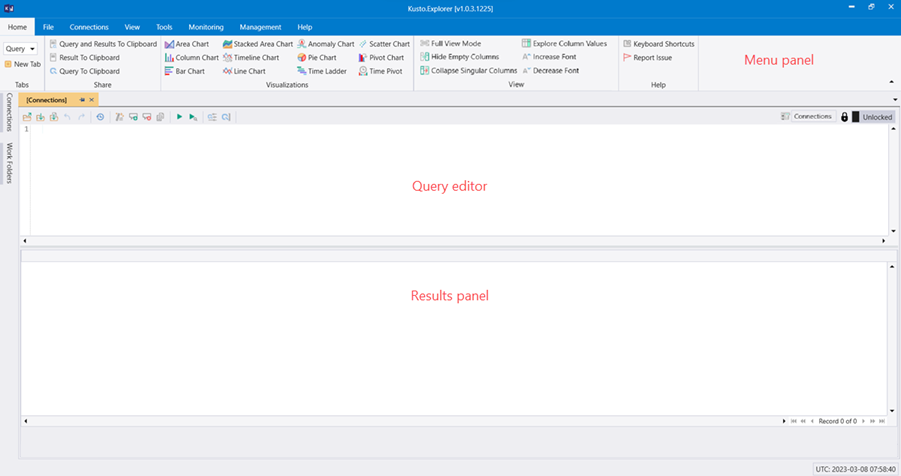
- UI Tools: Kusto Explorer (Azure Data explorer Web UI - primary tool)
- ADX (Jupyter) Explorer: Notebooks
- Azure Data explorer in Azure portal
satya - 12/26/2023, 2:29:20 PM
Kusto explorer
satya - 12/26/2023, 2:32:47 PM
Example dashboards
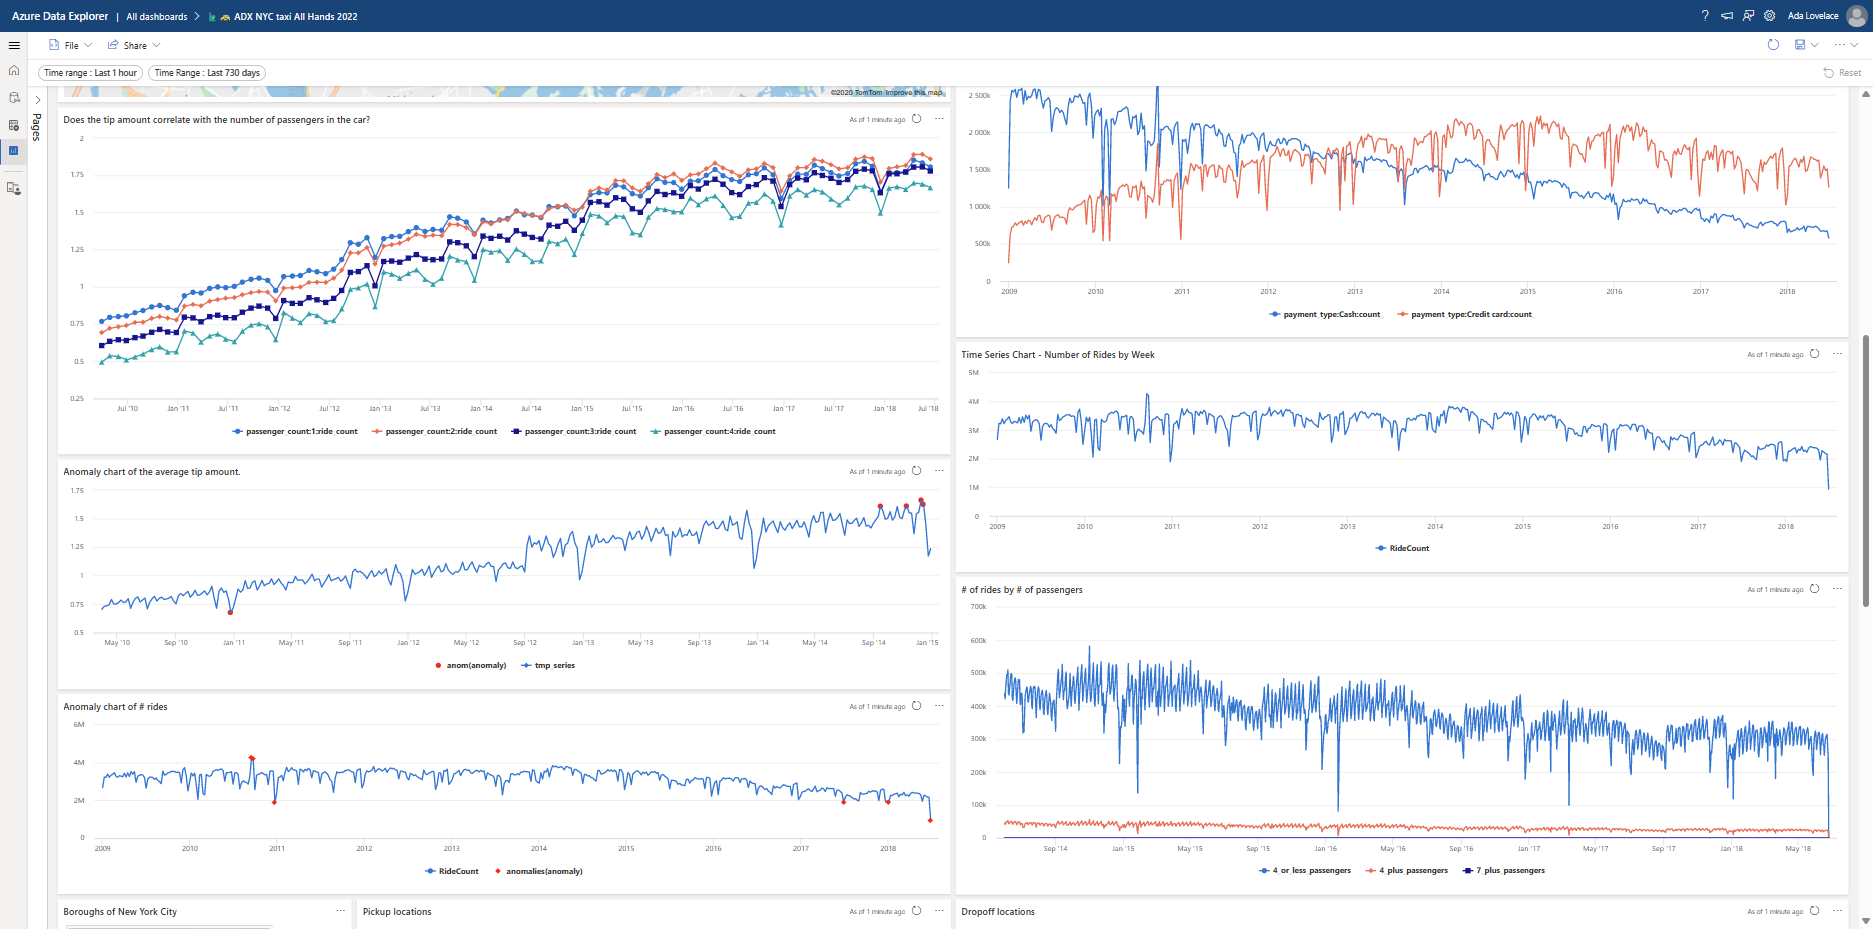
satya - 12/26/2023, 2:41:52 PM
How does ADX data can be used by other tools
- Excel - dedicated connector
- Grafana - dedicated plugin
- Kibana - K2bridge connector
- ODBC connector
- Tableau - ODBC connector
- Qlik - ODBC
- Sisense - JDBC
- Redash - dedicated connector
satya - 12/26/2023, 2:43:16 PM
What is the difference between Kusto Explorer and ADX web UI?
What is the difference between Kusto Explorer and ADX web UI?
Search for: What is the difference between Kusto Explorer and ADX web UI?
satya - 12/26/2023, 3:18:47 PM
Example
satya - 12/26/2023, 3:27:32 PM
A real time analytics usecase of web logs
satya - 12/26/2023, 3:34:24 PM
Grafana, Kibana, and PowerBI
- Grafana: Widely used for monitoring and visualizing time-series data from various sources. Often integrated with specific data stores or monitoring solutions. Highly customizable with a focus on real-time monitoring. Flexible alerting capabilities for monitoring metrics.
- Kibana: Strong in log analytics and real-time visualization within the Elasticsearch ecosystem. Often integrated with specific data stores or monitoring solutions. Customizable within the Elastic Stack ecosystem. Alerting features are often extended with Elasticsearch Watcher.
- Power BI: Well-suited for business intelligence, data analysis, and reporting with a focus on visualizations and insights.
satya - 12/26/2023, 3:36:45 PM
How does real time analytics work with ADX?
- Ingest the data
- Write reports using KQL
- Send the output to required destinations
- Schedule KQL jobs
- Real time dashboarding of KQL output via Grafana or PowerBI
- Write KQL functions to curate the data into destination tables
satya - 12/26/2023, 3:38:09 PM
What are some tools that can scehdule KQL jobs
- Azure Logic Apps
- Azure Dashboards
- Kibana, PowerBI
- ADF
- Azure Automation
- ADX scheduled queries
satya - 12/26/2023, 5:56:35 PM
Azure Data Explorer Notebooks (ADX Explorer)
Show images for: Azure Data Explorer Notebooks (ADX Explorer)
satya - 12/26/2023, 6:00:24 PM
MS Learn: Use a Jupyter Notebook and kqlmagic extension to analyze data in Azure Data Explorer
MS Learn: Use a Jupyter Notebook and kqlmagic extension to analyze data in Azure Data Explorer
satya - 12/26/2023, 6:21:56 PM
ADX for monitoring and dashboards
- Azure Monitor: Azure's centralized platform for monitoring and managing Azure resources, providing dashboards and alerts for ADX.
- Grafana: Open-source platform for monitoring and observability, used for creating interactive dashboards with ADX data.
- Kibana: Elasticsearch's visualization tool commonly used for log and metric visualization, integrated with ADX for data analysis and visualization.
- Power BI: Microsoft's business intelligence tool, integrated with ADX to create reports and dashboards for data analysis.
- Tableau: Business intelligence and analytics platform integrated with ADX for visualizations and dashboards.
- Microsoft Azure Dashboards: Azure's built-in dashboards providing a customizable and interactive way to visualize ADX data in real-time.
- GCP Data Studio: Google Cloud Platform's data visualization tool, integrated with ADX for creating interactive dashboards.
- Custom Web Applications: ADX's REST APIs enable developers to build custom web applications tailored for real-time monitoring and visualization.
satya - 12/26/2023, 6:42:32 PM
What is real time analytics
- It is the process of analyzing and making sense of data as it is generated or received, providing insights and actionable information instantly or near-instantly.
- It involves the rapid processing and interpretation of data streams to extract valuable insights, allowing organizations to respond quickly to changing conditions, make informed decisions, and take immediate actions.